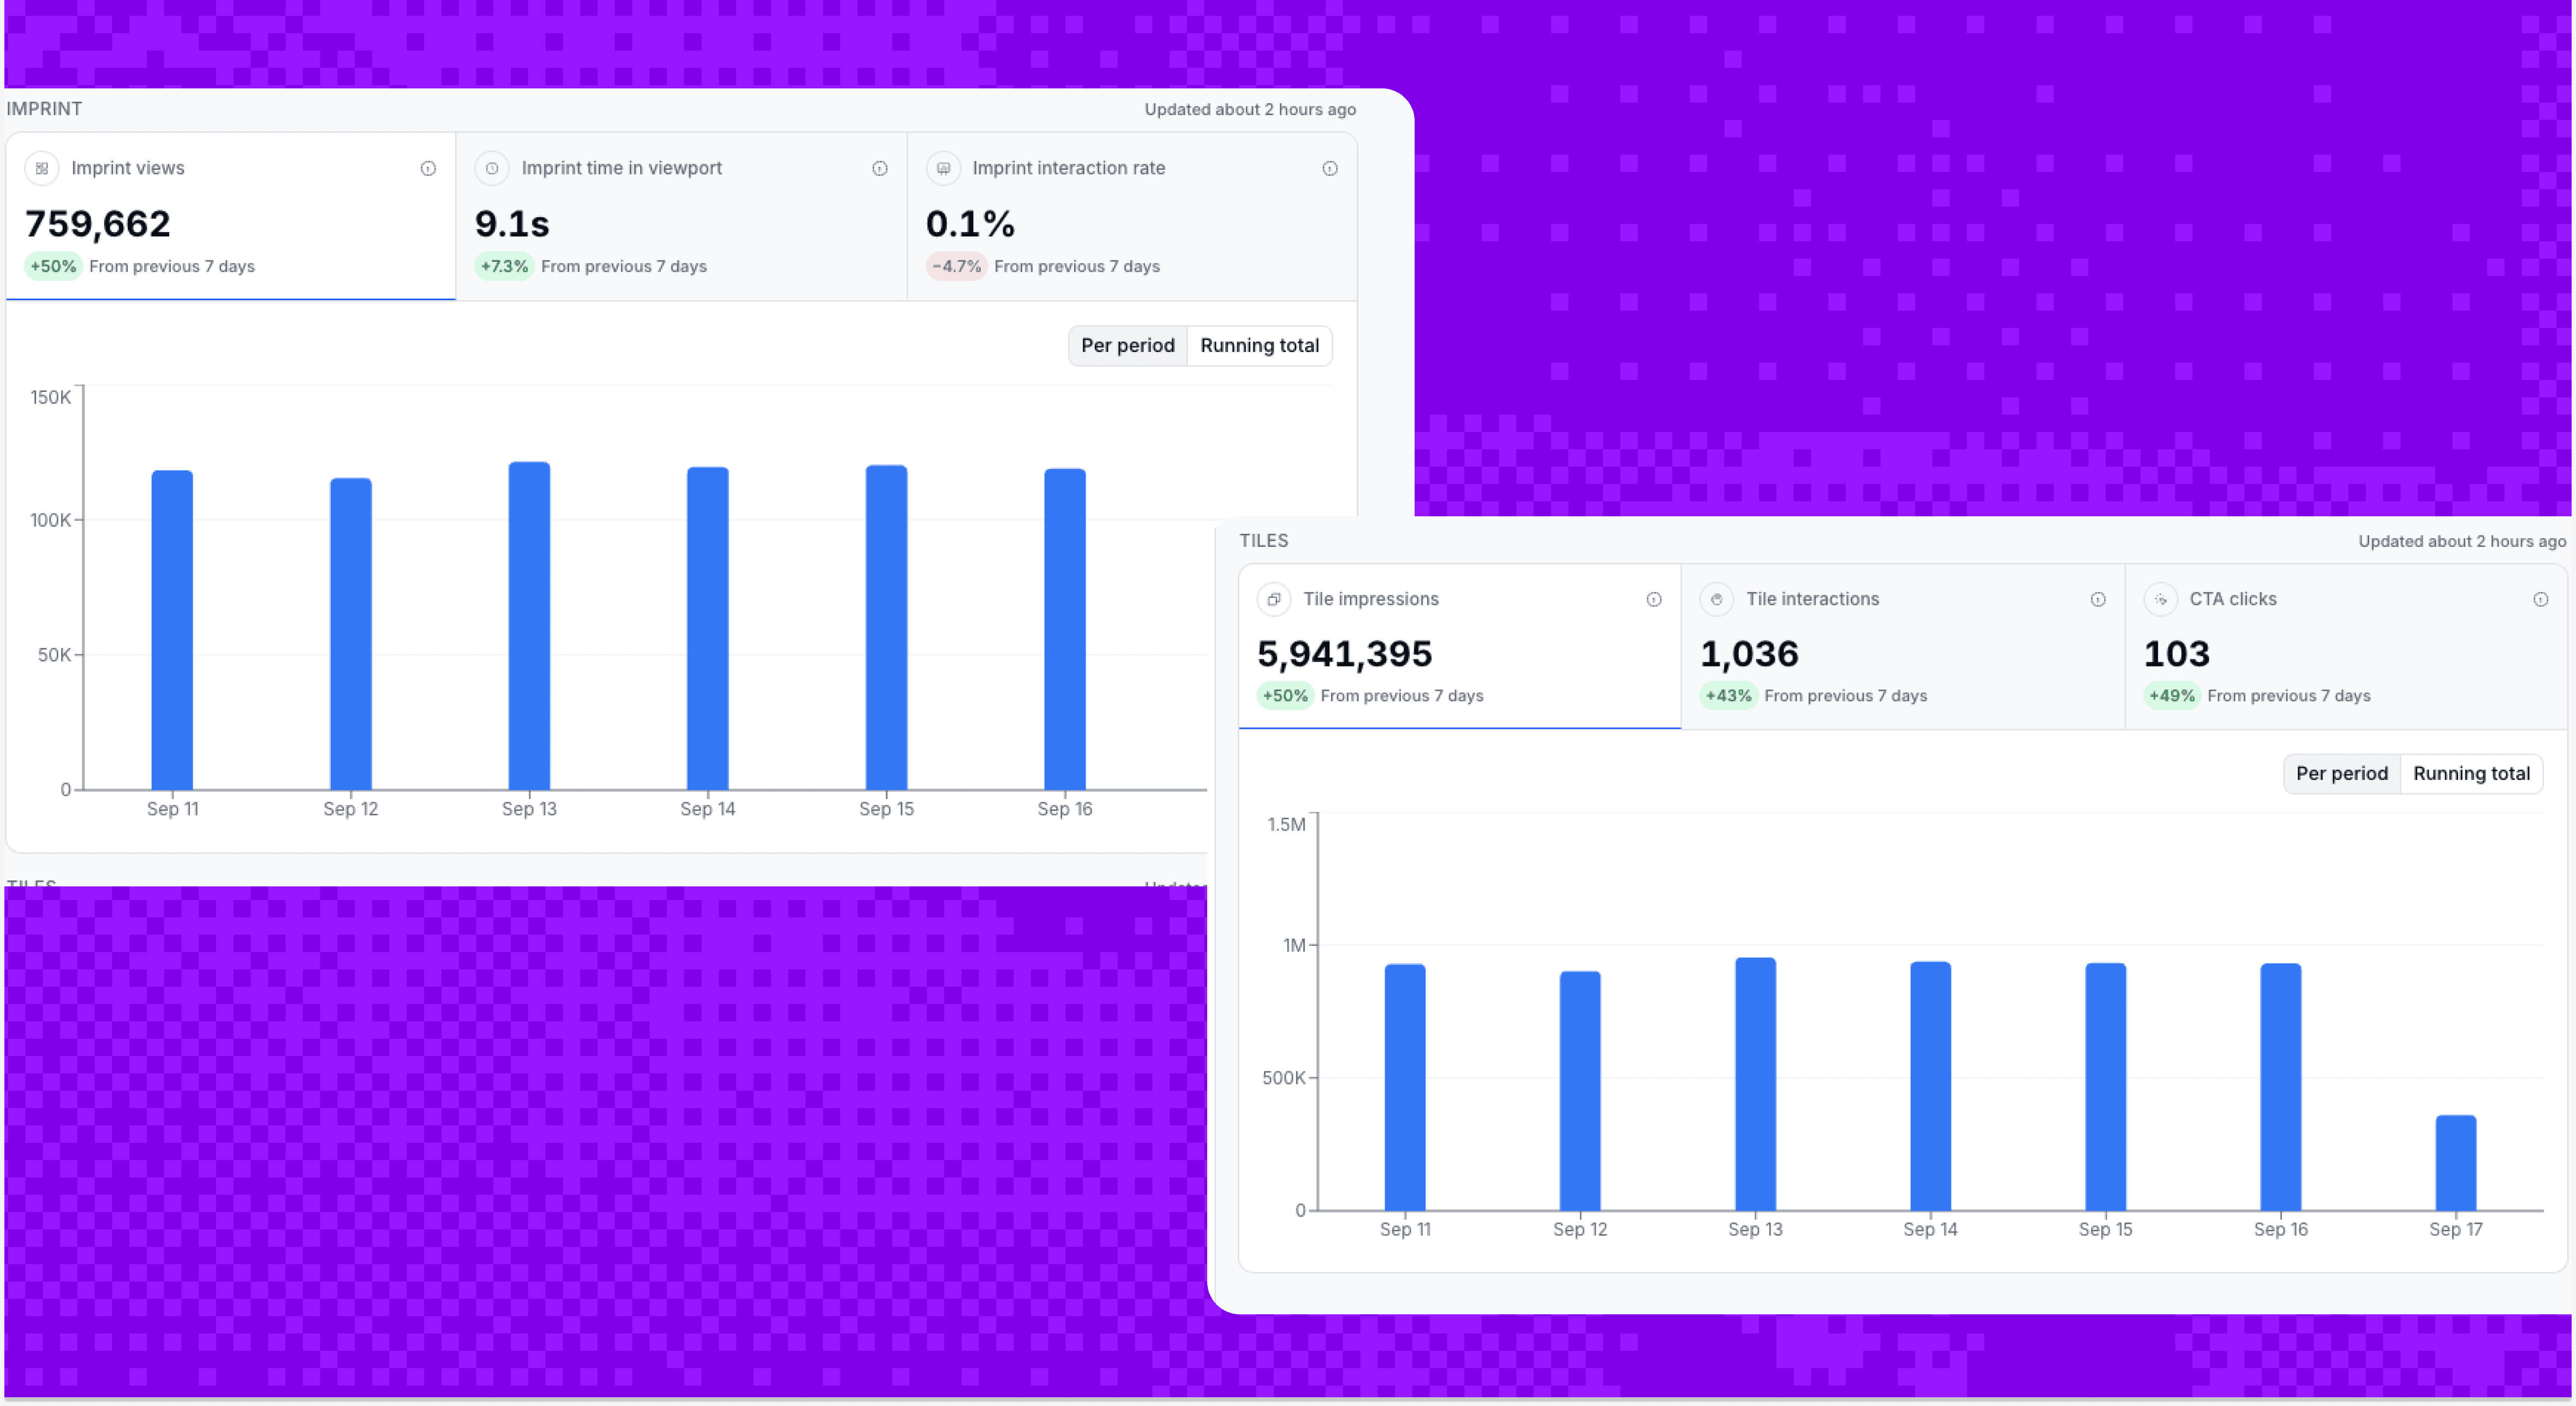
New and improved Gallery analytics
Gallery Analytics just got a serious upgrade: full reporting cards, per-Tile breakdowns and reports you can finally share straight with your client, all in one place.
Tags
Enhancement
Understand
Released
Ready to activate your content? Talk to our team.
Gallery Analytics just got a serious upgrade: full reporting cards, per-Tile breakdowns and reports you can finally share straight with your client, all in one place.
Every metric, finally together: Total views, average session length, interaction rate and CTA clicks now sit in one report, with quiz or poll results included automatically. No more piecing it together yourself.
Know what’s actually working: Every Tile gets its own row, impressions, clicks, CTR, CTA clicks and average frame time, so you can see exactly which piece of content is earning its place, not just how the Gallery performed overall.
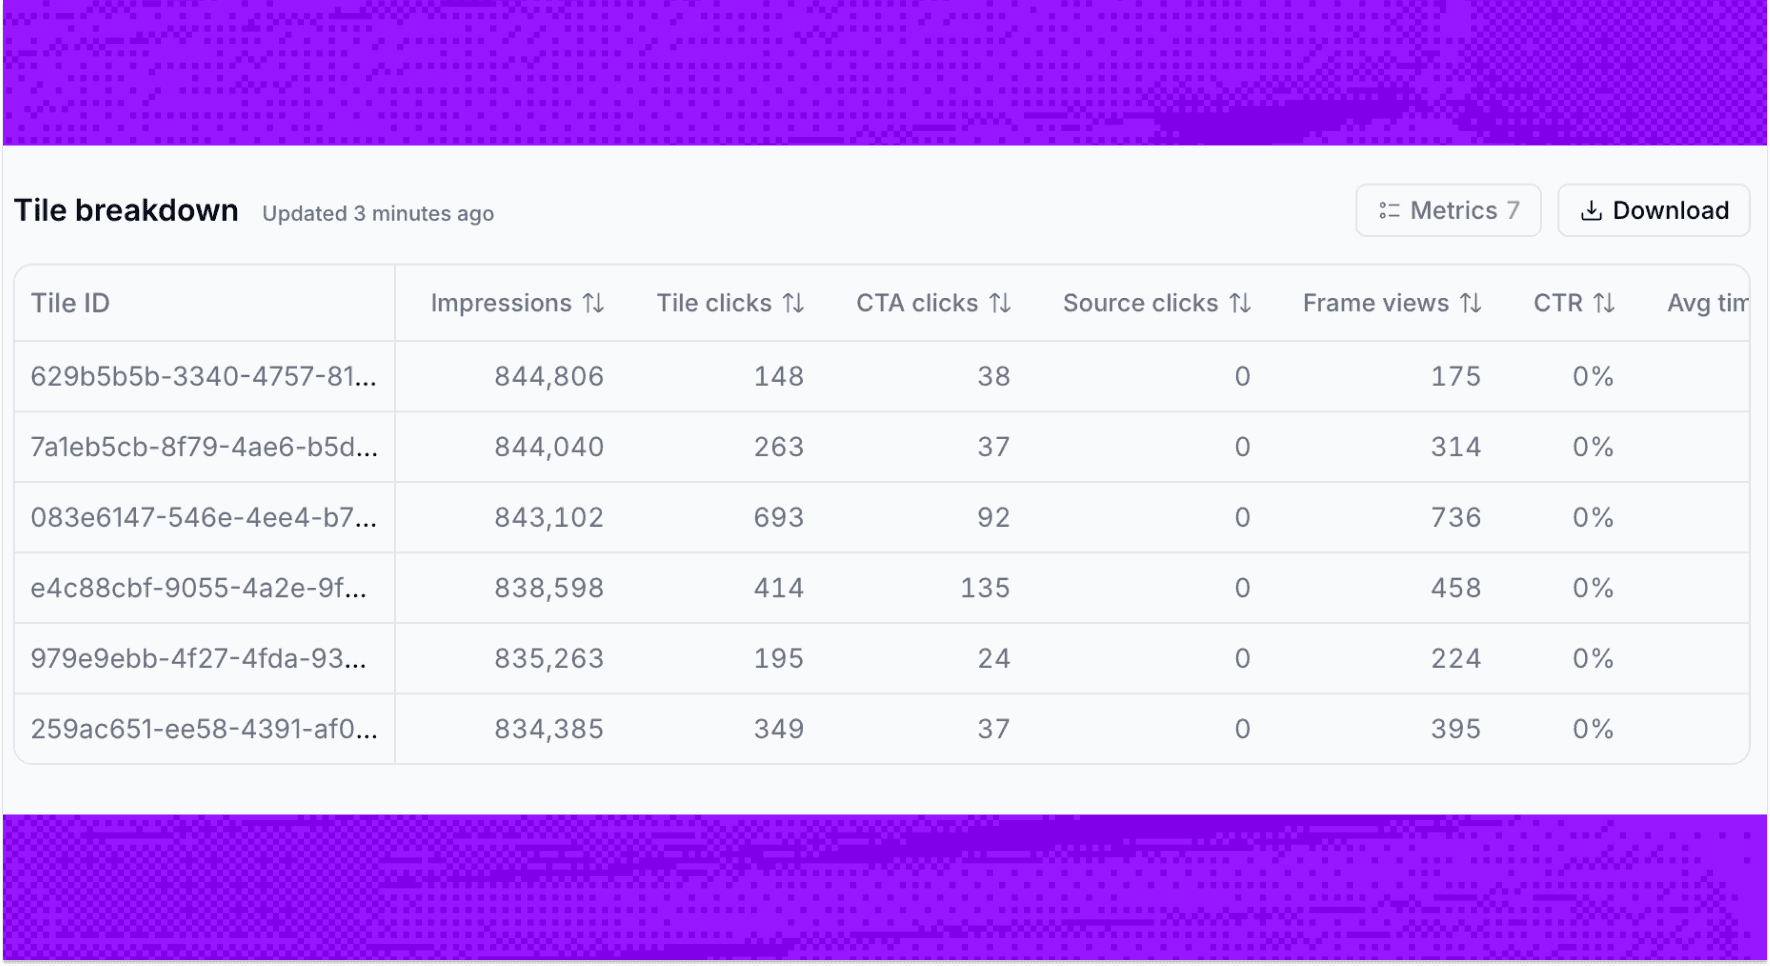
Your data, your way: Pull the last 7, 30 or 90 days, or set a custom range, then export the daily breakdown as CSV or XLSX in a click.

Impress your client instantly: Invite a customer in and they land on a clean, report-only page built around their Gallery’s performance, no dashboard chrome required.
More updates


Ready to build something your audience will remember?
Bring your world of content into one connected content system - and make every piece work harder.
Trusted by brands that take content seriously